Flow Cytometry
Principles of Flow Cytometry
Flow cytometry is normally used to analyze the expression of cell intracellular and surface molecules, characterize and define different cell types in a heterogeneous cell population, assess the purity of isolated subpopulations as well as analyze cell size and volume.
As shown in Figure 1, in sample preparation step, cells of interest are labeled with fluorochromes. Cells in suspension are then injected in a thin stream that is centralized hydrodynamically by the sheath flow co-injected, and hit by the laser beams. Light scatter is detected by forward and side photo detectors. Fluorescence is sorted in the optical bench with dichroic mirrors and filters and detected, amplified by photomultipliers. Signals are then analyzed by specific software.
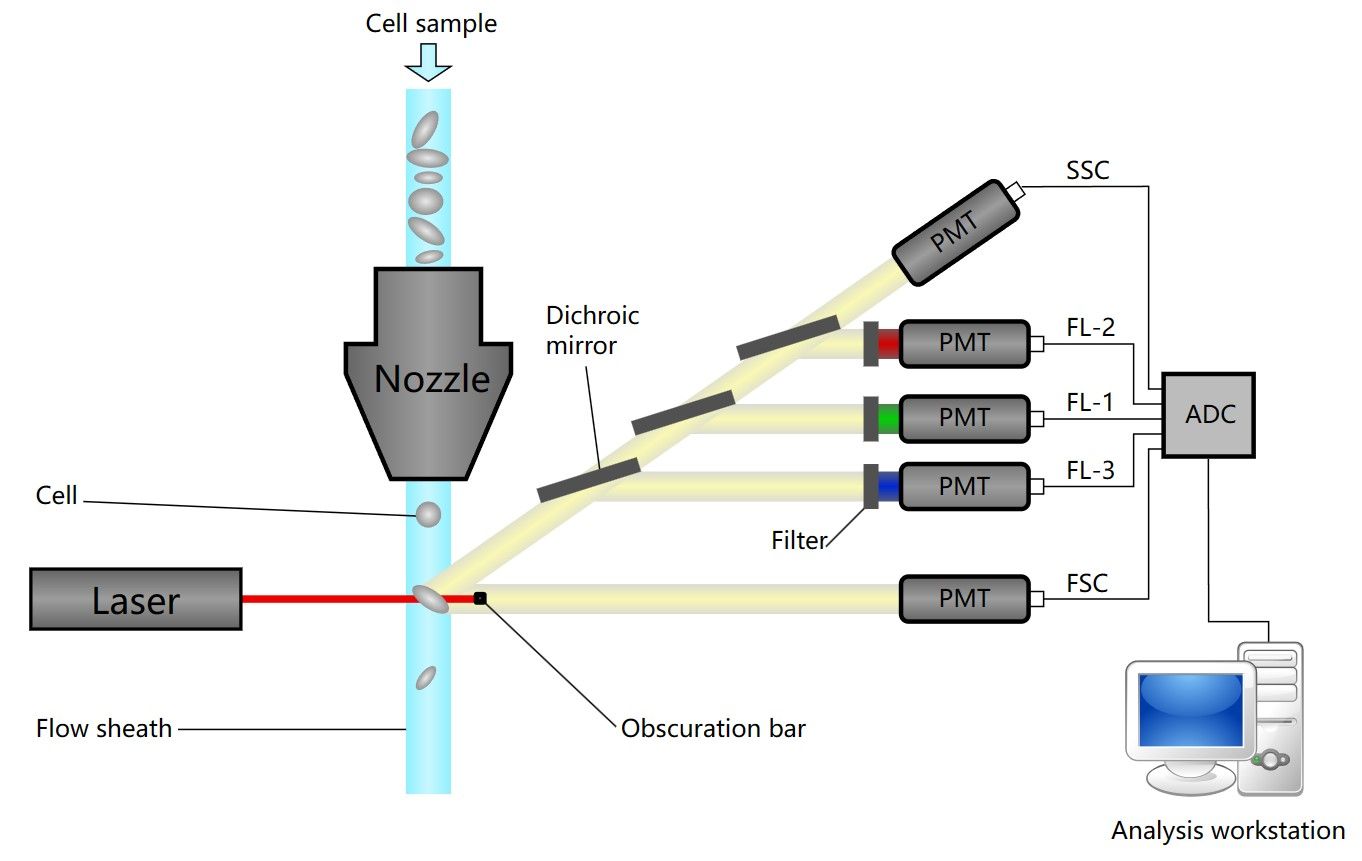 Fig.1 Schematic of a flow cytometer1.
Fluorophores
Fluorophores are fluorescent markers used to detect the expression of nucleic acids or proteins. They functionally accept light energy at a given wavelength and re-emit it at a longer wavelength. There are two major kinds of fluorophores with great potential application in flow cytometry.
- Single and Tandem Dyes
- Fluorescent Proteins
Single dyes such as fluorescein isothiocyanate (FITC), Allophycocyanin (APC), and Phycoerythrin (PE) have been available for many years. Tandem dyes comprise a small fluorophore covalently coupled to another fluorophore. When the first dye is excited and reaches its maximal excited electronic singlet state, its energy is transferred to the second dye. This activates the second fluorophore, which then produces the fluorescence emission.
Fluorescent proteins, like green fluorescent protein (GFP), yellow fluorescent protein (YFP), red fluorescent protein (RFP), and mCherry have become widely used for flow cytometry analysis and cell sorting. The fluorescent proteins are often co-expressed or expressed as a fusion with the protein of interest.
Conjugated Antibodies in Flow Cytometry: Direct vs Indirect Fluorophore Labeling
Commonly, the fluorophores used as readouts in a flow cytometry experiment are covalently bound to an antibody. When a conjugated antibody is used in a cell-based assay, light emitted by the fluorophore serves as a direct indicator of the amount of antibody present in or on the cell. By using conjugates that specifically bind to a protein, a researcher can directly quantify the target of interest in every cell, based on the level of fluorescence emitted by that cell. This process is referred to as direct detection, or direct flow cytometry.
The alternative approach, indirect flow cytometry, utilizes a secondary antibody directed against immunoglobulins (Igs) from the host in which the primary antibody was generated. In this method, the secondary antibody is conjugated to the fluorophore, leaving the primary antibody unmodified.
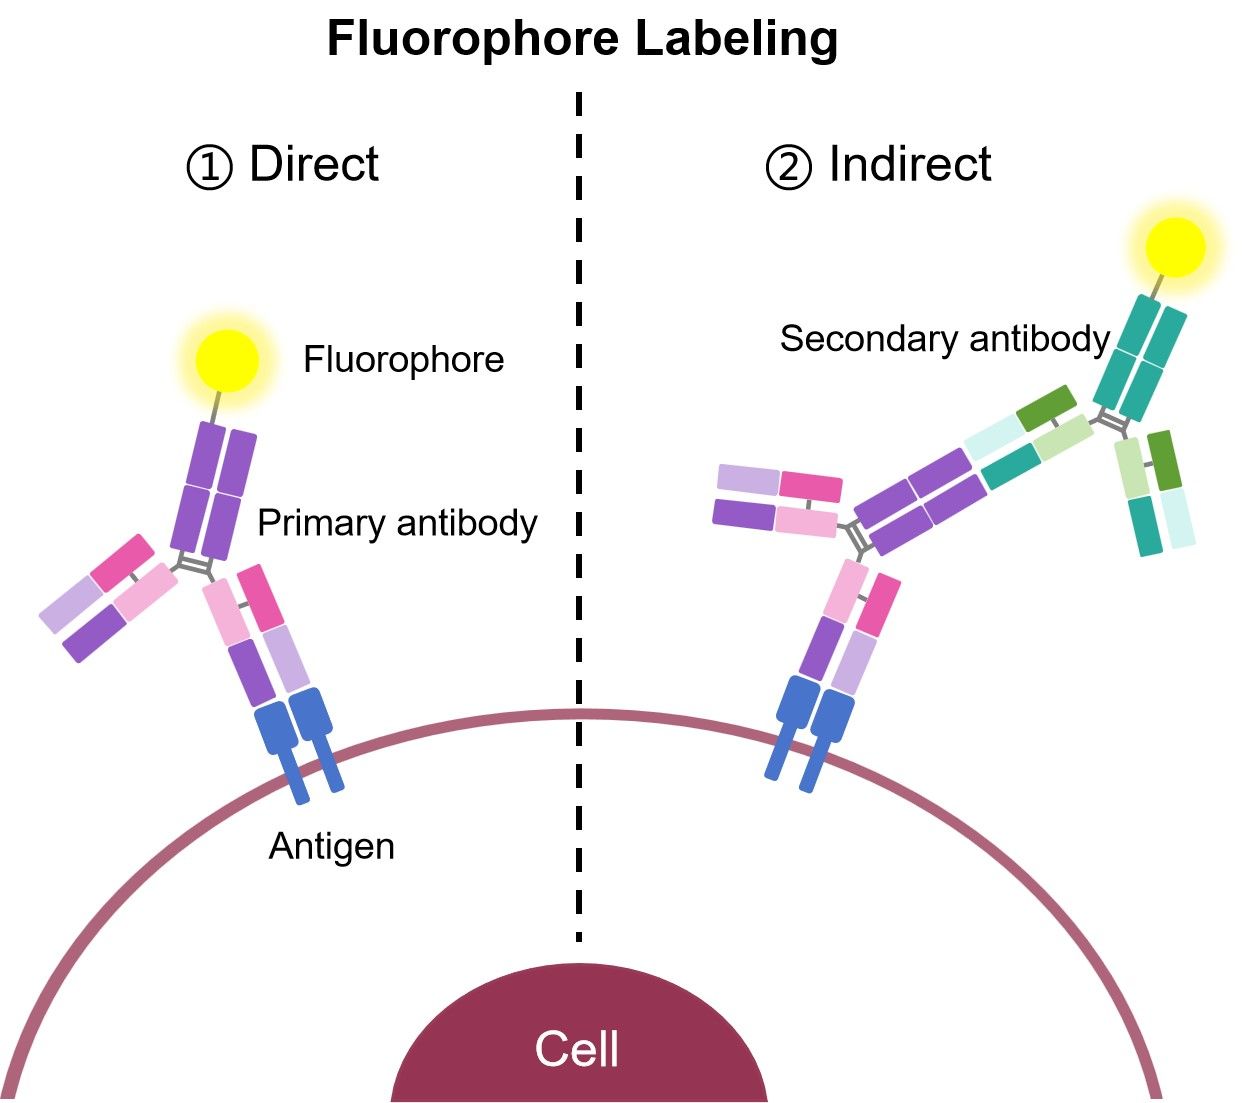 Fig.2 Direct and indirect immunofluorescence.
Direct Versus Indirect Staining for Flow Cytometry
| Advantages | Disadvantages | |
|---|---|---|
| Direct: Directly conjugated antibodies |
|
|
| Indirect: Unconjugated primary antibodies + conjugated secondary antibody |
|
|
How to choose?
- Indirect flow cytometry may be preferred over direct flow cytometry when conjugation of the primary antibody may cause steric changes that affect specificity and function.
- Indirect flow cytometry may also be preferred when increased signal is desired. More than one secondary antibody can bind to a primary antibody, thereby amplifying the signal derived from each antigenic molecule bound by the primary antibody.
Data Analysis
Flow cytometry data analysis is fundamentally based on the principle of gating. Gates and regions are placed around populations of cells with common characteristics, usually forward scatter (FSC), side scatter (SSC) and marker expression. The size and granularity of cells can be identified on the basis of their FSC and SSC characteristics. Distinguishing populations of cells can be relatively straight forward for cell lines where there is only one type of cell, but it can be more complex for samples where there are multiple cell types.
Debris and dead cells often have a lower level of FSC and are found at the bottom left corner of the density plot. Events can also be displayed as a dot plot where no density information is shown or as a contour map to show the relative intensity of scatter patterns. It is down to the user preference as to which display is preferred, but sometimes discrete populations of cells are easier to visualize on contour diagrams.
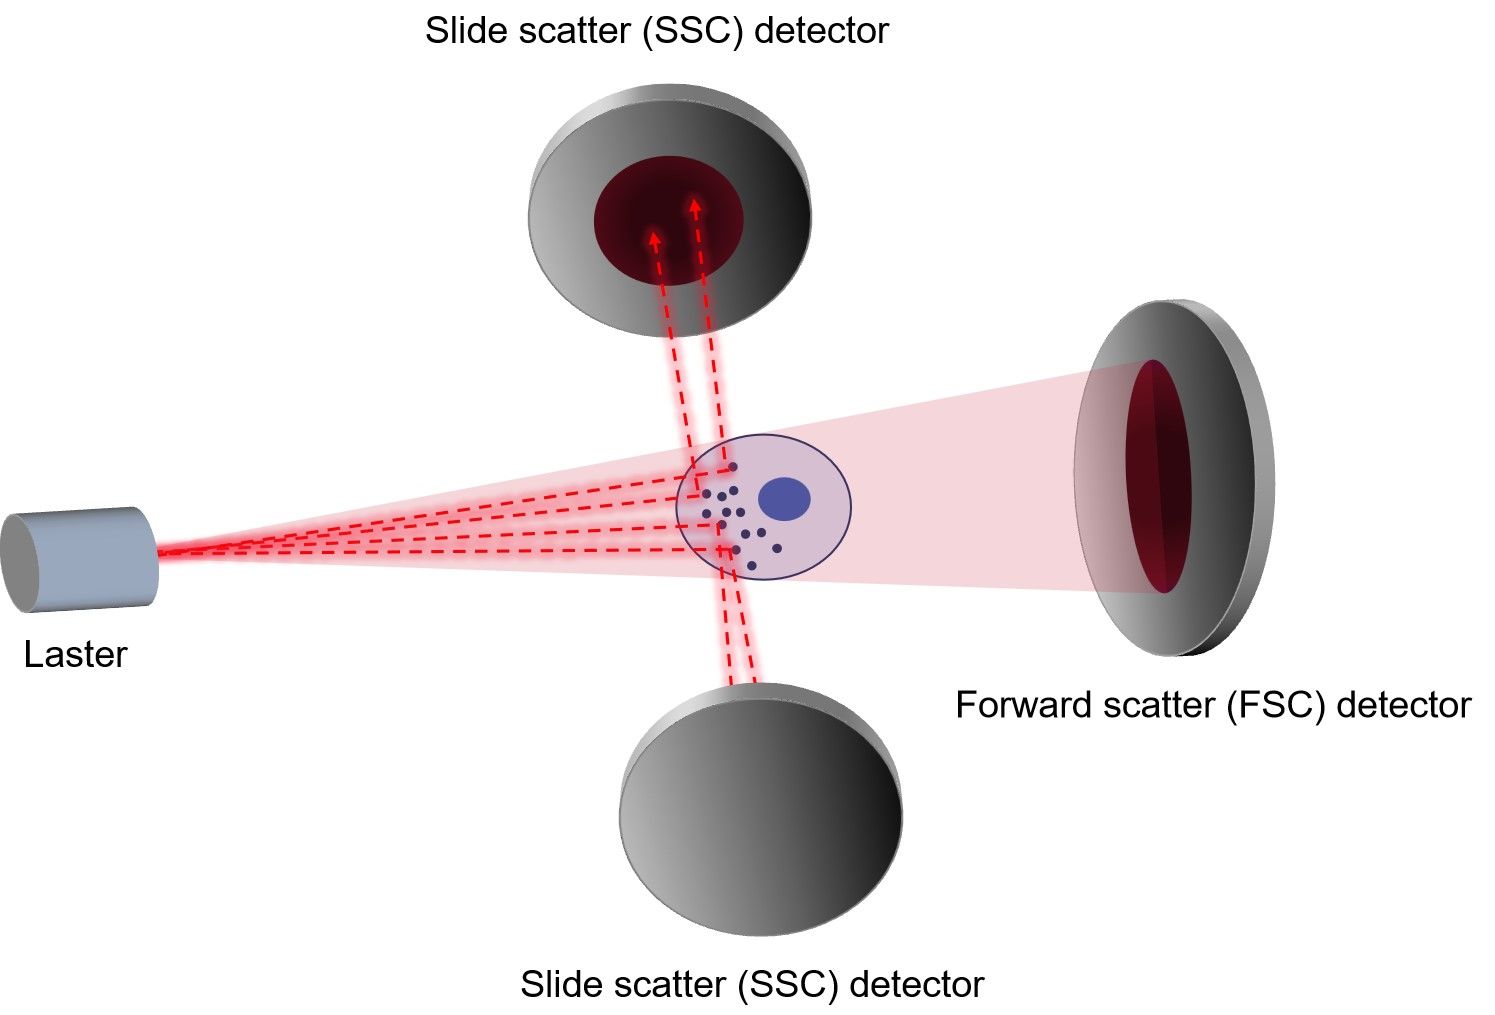 Fig.3 Measurement of FSC and SSC.
Common Applications
- Immunophenotyping
The most common use of flow cytometry is the identification of markers on cells. Immunophenotyping can be simply identifying a cell by a single marker or more complex identification of cells, using homing profile, activation states and cytokine release all in one panel. As a consequence, experimental protocols are often a combination of surface and intracellular staining.
- Apoptosis
One of the most common features of apoptosis that can be measured by flow cytometry is externalization of phosphatidylserine (PS), a phospholipid found in the inner membrane of healthy cells. Annexin V binds to phosphatidyl serine and thus annexin V labeled with fluorophores allow apoptosis to be assessed, usually in combination with a viability dye such as propidium iodide (PI) to distinguish apoptotic from necrotic cells.
DNA fragmentation, which occurs during the late stages of apoptosis, can be also measured by flow cytometry using the sub-G1 assay. The small DNA fragments generated during apoptosis leak out of cells, decreasing the total DNA content of apoptotic cells. By staining DNA with PI, hypodiploid apoptotic cells can be counted in the sub-G1 peak of the PI histogram. Besides, early apoptosis can also be measured by potentiometric dyes which assess the reduced mitochondrial potential of cells, such as JC-1, tetramethylrhodamine ethyl ester (TMRE) and tetramethylrhodamine methyl ester (TMRM). These dyes aggregate in mitochondria of non-apoptotic cells and brightly fluoresce. When the mitochondrial membrane potential collapses, the dye disperses into the cytoplasm in its monomeric form leading to reduced fluorescence or a change in color.
- Proliferation and Cell Cycle
Cell proliferation can be measured by flow cytometry using several methods. One approach is to stain with an antibody against a proliferation marker such as Ki67 or MCM2. Besides, you can incubate your cells with BrdU, which incorporates into DNA during S-phase of the cell cycle. Incorporated BrdU can be detected using fluorescently labeled anti-BrdU antibodies. When combined with a DNA stain such as PI, the relative proportion of cells in S-phase can be determined.
Other Applications
- Monocyte oxidative burst
- Neutrophil oxidative burst
- Monocyte phagocytosis
- Neutrophil phagocytosis
- Microbiological analysis
- Cell trafficking
- Cellular and antibody or complement-mediated cytotoxicity
- Sorting on the basis of morphology (FSC or SSC) and/or fluorescent characteristics
Flow Cytometry Related Sections
Creative Biolabs presents a presentation that will be invaluable to beginners in flow cytometry and act as a fact-packed synopsis for those of you interested in teaching others about the virtues of this powerful application. To further assist learning, we have introduced the following sections for your viewing. Protocol and troubleshooting guide are provided under each experimental approach. Please refer to the corresponding section for details.
- Direct Staining Flow Cytometry
- Indirect Staining Flow Cytometry
- Intracellular Staining Flow Cytometry
- Cell Cycle Staining Flow Cytometry
- Cell Preparation for Flow Cytometry
- Cell Activation
Reference
- From Wikipedia: By Kierano - Own work, CC BY 3.0, https://commons.wikimedia.org/wiki/File:Cytometer.svg